
A spreadsheet is where most online stores start tracking stock, and for a small catalog it works well. The trouble is rarely Excel itself but how the sheet is built: one column of totals people overwrite by hand, no record of what changed, and no warning before a product runs out. This guide to inventory management in Excel builds the sheet properly, step by step: products, movements, SUMIFS formulas, data validation and low-stock formatting. Then it covers where Excel stops being enough and how to bring your sheet into StoreChart with a CSV import.
Building an Excel inventory spreadsheet
The workbook needs two sheets:
- Products: one row per item.
- Movements: one row for every time stock changes.
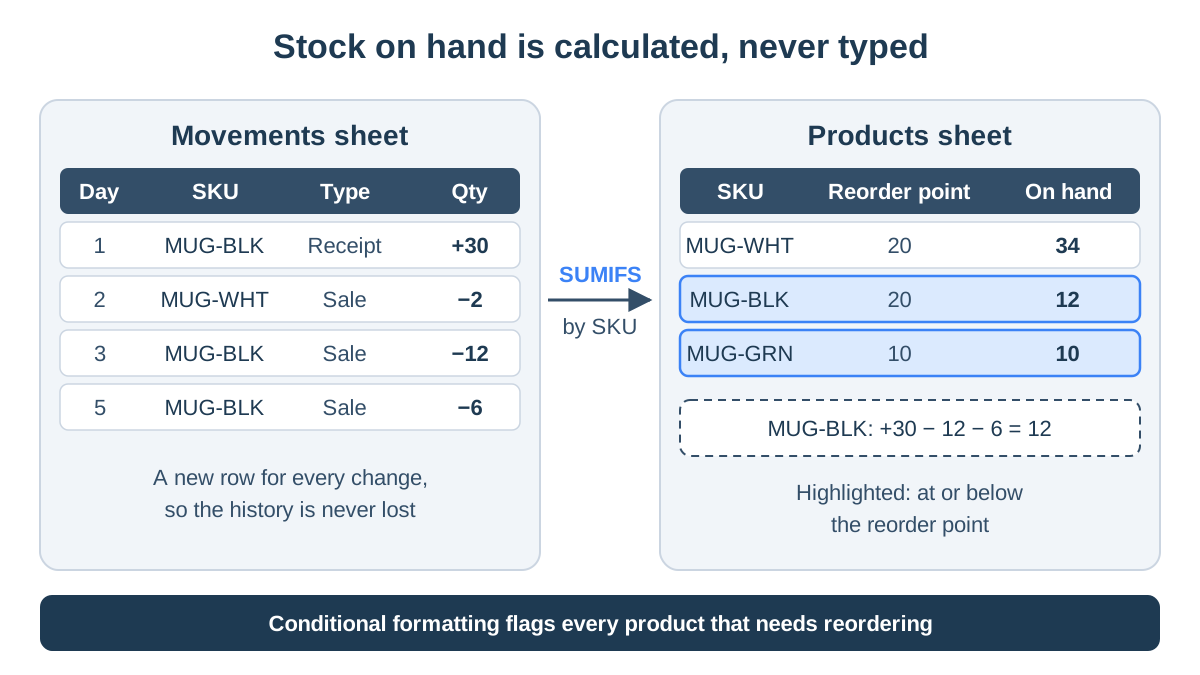
Stock on hand is never typed in; it is calculated from the movements. That single decision separates a sheet you can trust from one you recount every month.
- 1
Create a Products sheet
Add one row per SKU with columns for SKU, name, reorder point, unit cost, supplier and location, and format the range as a table so formulas extend to new rows.
- 2
Create a Movements sheet
Record every receipt, sale, return and adjustment as a new row with the date, SKU, movement type and a signed quantity, instead of editing a total.
- 3
Add data validation
Limit the SKU column on the Movements sheet to the SKUs on the Products sheet, the Type column to a fixed list, and the Quantity column to whole numbers.
- 4
Calculate stock with SUMIFS
On the Products sheet, add a Stock on hand column that uses SUMIFS to add up the Movements quantities for each SKU.
- 5
Highlight low stock
Add a conditional formatting rule that colors a product row when its stock on hand is at or below its reorder point.
- 6
Review and count every week
Sort by stock on hand, reorder what is flagged, and compare a physical count of a few products with the sheet, recording any difference as an adjustment row.
Columns for the Products sheet
| Column | What goes in it | Why it matters |
|---|---|---|
| SKU | A unique code per product and variant | The key every formula matches on. See what a SKU is |
| Name | The product name customers see | Readable reports |
| Reorder point | The stock level that should trigger a purchase | Drives the low-stock highlight |
| Unit cost | What one unit costs you | Stock value and margin |
| Supplier | Who you buy it from | Who to call when it's flagged |
| Location | Shelf, room or warehouse | Where to find it when you count |
| Stock on hand | A formula, never typed | Calculated from Movements |
Give every variant its own SKU. A t-shirt in three sizes is three rows, because you can run out of medium while large is still on the shelf.
Movements sheet vs overwriting totals
When someone changes "40" to "37", the sheet forgets why: three sales, a damaged unit or a miscount. A movements sheet records each change as its own row:
- Date: when stock moved.
- SKU: the product that moved.
- Type: Receipt, Sale, Return or Adjustment.
- Quantity: signed, positive for receipts and returns, negative for sales and write-offs.
- Reference: an order or supplier invoice number.
The result is a history you can filter by product or date, and a stock figure you can rebuild at any time.
Excel inventory formulas: SUMIFS
Format both sheets as tables (Ctrl+T) and name them Products and Movements. You need three formulas:
- Stock on hand: SUMIFS over the Movements quantities for the row's SKU.
- Stock value:
=[@[Stock on hand]]*[@[Unit cost]]. - Units sold in 30 days: useful for setting the reorder point.
Stock on hand for each product:
=SUMIFS(Movements[Quantity], Movements[SKU], [@SKU])
Units sold in the last 30 days:
=-SUMIFS(Movements[Quantity], Movements[SKU], [@SKU], Movements[Type], "Sale", Movements[Date], ">="&TODAY()-30)
Low-stock conditional formatting
- Select the Products table rows.
- Choose Conditional Formatting, then New Rule, then "Use a formula".
- Enter
=$C2>=$G2, where C is the reorder point and G is stock on hand. - Pick a fill color.
Every product at or below its reorder point now stands out, and sorting by stock on hand puts them at the top.
Data validation against errors
On the Movements sheet, set three rules:
- SKU: a list that points at the SKU column of Products, so a typo cannot create a product that doesn't exist.
- Type: a fixed list of four values.
- Quantity: whole numbers only.
Validation won't catch a wrong number, but it removes a whole class of silent mistakes.
Example: a ceramic mug store sheet
A store selling ceramic mugs might have this Products sheet:
| SKU | Name | Reorder point | Stock on hand |
|---|---|---|---|
| MUG-WHT | White mug | 20 | 34 |
| MUG-BLK | Black mug | 20 | 12 |
| MUG-GRN | Green mug | 10 | 10 |
Black and green are highlighted. Black is below its reorder point, and green has reached it exactly.
The figures in this article's examples are illustrative only and do not reflect actual customer data.
Limits of inventory management in Excel
- No live connection to the store. Every order has to be typed, pasted or imported. Between updates, the sheet is wrong, and customers can buy stock that is already gone.
- Overselling across channels. If you sell on a website and a marketplace, or run two stores, each channel knows only its own sales. The sheet catches up only when someone updates it.
- Manual errors. A formula dragged one row short, a sort applied to one column only, a pasted value over a formula. Nothing tells you.
- Several editors. Two people editing a shared file, or a copy saved as "stock final v3", and you have two versions of the truth.
- No history unless you build it. The movements sheet solves this, but only if everyone uses it every time.
- Costs go stale. A single unit cost column doesn't capture changing supplier prices, or the freight and duties on an import, so stock value and margin drift. Read more about landed cost.
Signs Excel is no longer enough
Look for these signs rather than an order count:
- You have sold something you didn't have, and had to refund or apologize.
- More than one person updates stock.
- You sell through more than one store or channel. Managing several stores is covered on the multi-store page.
- Reconciling the sheet against the store takes longer than acting on what it tells you.
- You import goods and need the real cost per unit, including shipping and duties, as the imports module calculates.
- Stock sits in more than one place. See our guide to multi-warehouse inventory management.
For the principles behind all of this, start with the complete guide to inventory management.
Excel vs a store management system
A good spreadsheet and a store management system answer the same questions, how much stock you have and how much you made, in different ways. In a spreadsheet you build and maintain every formula; in a system the data comes from your store and the calculations are built in:
| Topic | Excel spreadsheet | StoreChart |
|---|---|---|
| Orders | Typed, pasted or imported | Arrive automatically from connected WooCommerce and Shopify stores |
| Stock | SUMIFS over a movements sheet | Each order reduces stock, receipts add to it, and every product has a low-stock threshold |
| Profit per order | A formula someone maintains | Gross and net profit after product cost, shipping and fees |
| Import costs | Spread across products by hand | Freight, duties and insurance feed into landed cost |
| Customers | A separate sheet with no link to orders | Customer profiles with order history, tags and charges |
| Team | A shared file and several versions | A personal login and role for each person, with the option to hide costs and profit |
| Flexibility | Any column or formula you like | A fixed structure, with orders and customers exportable to CSV for your own analysis |
| Cost | Nothing extra if you already have Excel | A free plan, and paid plans that differ by stores, orders and users |
Excel's flexibility is real, and many store owners keep using it for one-off analysis after they switch. Note that StoreChart doesn't push stock back to your connected stores, so availability on the site is still managed in WooCommerce or Shopify. You'll find the plans on the pricing page.
Moving from Excel to StoreChart with CSV
In StoreChart, orders from connected WooCommerce and Shopify stores come in automatically and reduce available stock, while stock receipts add to it. Your sheet becomes the starting point:
- Clean the SKUs. One row per SKU. Rows without a SKU get a generated code, and a SKU repeated in the file is imported only once. Stick to letters, numbers, dashes and dots, up to 50 characters, since the importer flags anything else. Keep the same SKUs your store uses, because incoming orders are matched to products by SKU.
- Rename the headers to the field names the importer expects, in English even if the content is in Hebrew:
sku,name,price,cost,category,stock_quantity, and optionallydescription. Supplier and location columns are not imported. - Save as CSV UTF-8. The wizard accepts .csv files only, and offers a sample file with the expected columns.
- Import into the right store. Imports are per store. SKUs that already exist in that store are skipped, not updated. How many products you can import depends on your plan's product quota.
- Check the opening stock. Each
stock_quantityis recorded as an opening receipt at the row's cost, in the store's default warehouse. To load stock for another warehouse, use a stock intake with a CSV of SKU, quantity and cost, and pick the destination warehouse. - Turn on inventory tracking. Imported products start with tracking off unless the file has a
track_inventorycolumn set totrue. Then set each product's low-stock threshold so it appears in the low-stock filter.
Customers, orders and order lines can be imported the same way. The CSV integration page lists what each file needs.
Frequently asked questions
Is Excel good enough for inventory management?
For a small catalog run by one or two people, often yes, as long as stock is calculated from a movements sheet rather than typed over. It stops being enough when you sell in more than one channel, when several people edit the file, or when you need to know what stock is worth after import costs.
How do I calculate stock on hand in Excel?
Record every movement as a row with a signed quantity, positive for receipts and returns, negative for sales. Then add a column on the products sheet with SUMIFS, which adds up the Quantity column of the movements sheet wherever the SKU matches the product's SKU.
Can an Excel inventory sheet sync with my online store?
Not by itself. A workbook has no connection to WooCommerce or Shopify, so every sale has to be typed, pasted or imported, and between updates the sheet is out of date. Teams sometimes build scripts to fill the gap, but then they maintain the script as well as the sheet.
How do I move my Excel inventory into StoreChart?
Rename your columns to sku, name, price, cost, category and stock_quantity, save the sheet as a CSV file and import it into the right store with the CSV import wizard. Each stock_quantity becomes an opening stock receipt at that row's cost, and SKUs that already exist in the store are skipped rather than overwritten.