
For most online stores, inventory holds the largest share of the business's cash, and it is also where small mistakes turn into big problems fast: a product that sells on the site but isn't on the shelf, a supplier order that arrives too late, or boxes of a model nobody buys. This guide explains what inventory management is and what it is for, walks through the concepts every store owner needs, with worked examples, and covers the main inventory management methods. Then it looks at managing stock across several stores and channels, when a spreadsheet stops being enough, and how to set up an inventory process step by step.
Inventory management: definition and goals
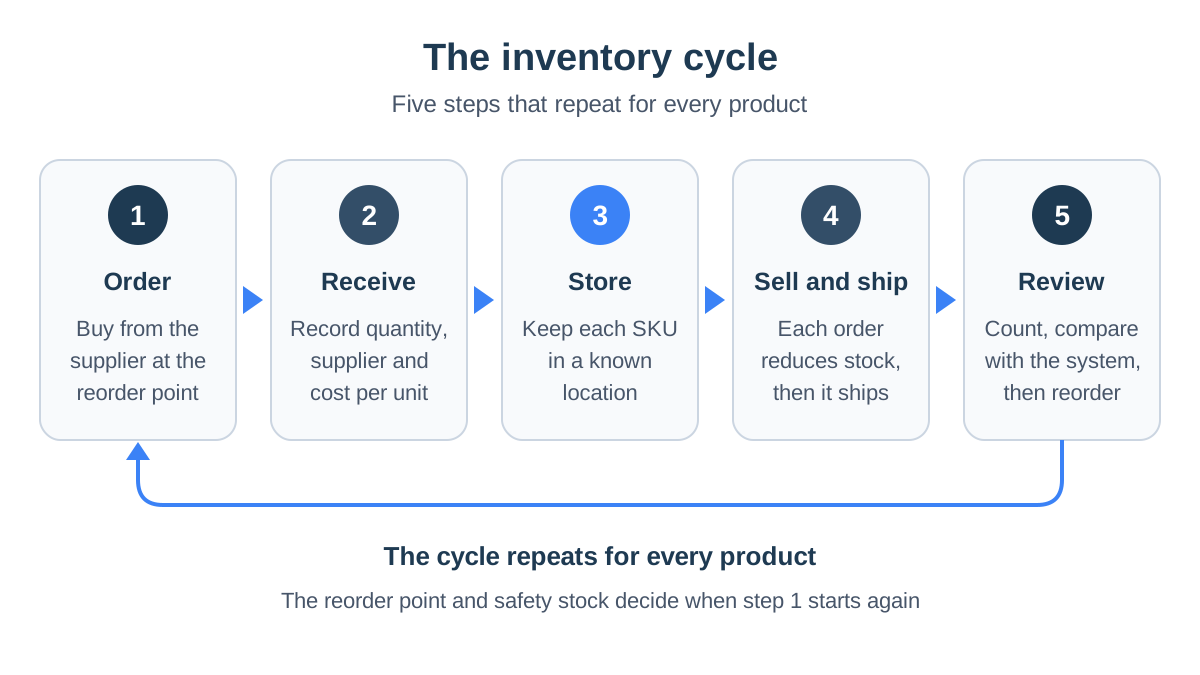
Inventory management is the planning, recording and control of the goods a business holds: how many units of each product it has, where they are, what they cost and when to order more. It is less a count of the shelf than a repeating cycle:
- Order from a supplier.
- Receive and record the goods.
- Store them.
- Sell and ship.
- Check when it is time to order again.
For a short definition with the basic formulas, see what is inventory management in the glossary. This guide goes broader and focuses on practice.
Inventory management has four goals, and they pull in opposite directions:
- Don't miss sales. An out-of-stock product sends the customer to a competitor, sometimes for good.
- Don't bury cash. Every unit on the shelf is money paid out that hasn't come back yet, plus the cost of storing it.
- Know the real cost. Without an accurate cost per unit, the profit on every order is inaccurate too.
- Keep the numbers matching the shelf. Stock that exists in the system but not in reality causes cancellations, refunds and lost trust.
Good inventory management aims neither for zero stock nor for deep stock of everything. For each product it finds the quantity that balances the two risks, based on how fast it sells, how long the supplier takes and how much it matters.
Key inventory management concepts
SKU: an identifier for every item
A SKU (stock keeping unit) is an internal code that identifies one item in stock. A shirt in three sizes and two colors is six SKUs, because each combination has its own quantity. Without a unique, consistent SKU you can't:
- Connect movements: what was received, sold and counted.
- Match orders: from several stores to the same item.
- Trace gaps: down to the exact size and color that is short.
For how to structure a good code, see what is a SKU.
Reorder point and safety stock
Three terms work together:
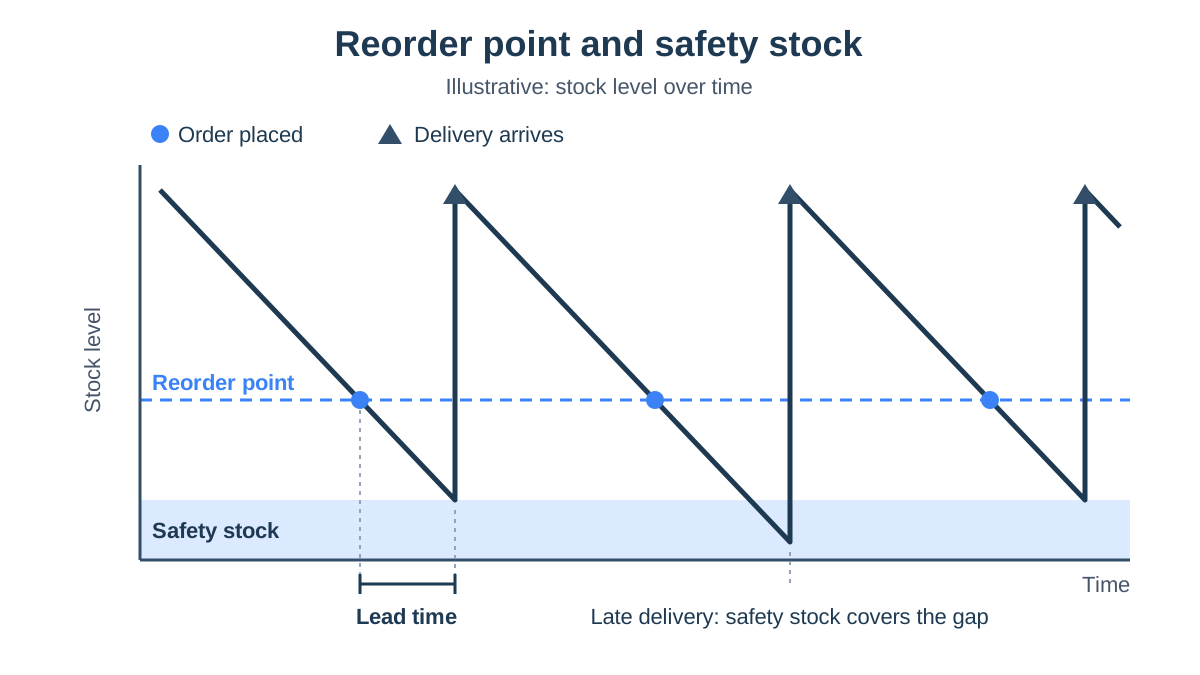
- Lead time: the time from placing an order with the supplier until the goods are ready to sell, including production, shipping and customs clearance.
- Safety stock: the extra quantity you hold to absorb a supplier delay or a jump in sales.
- Reorder point: the stock level at which you order again, so the new goods arrive before you run out.
Example: sizing safety stock
Say a store sells an average of 8 units a day of a product, and up to 10 on strong days. The supplier usually delivers in 14 days, sometimes only after 18. A simple way to size safety stock is to compare the worst case with the normal case:
- Worst case: 10 units a day × 18 days = 180 units.
- Normal case: 8 units a day × 14 days = 112 units.
- Safety stock: 180 − 112 = 68 units.
- Reorder point: normal demand during the lead time plus safety stock, 112 + 68 = 180 units.
When available stock drops to 180, you order. Safety stock carries the store through a late shipment or a sales spike.
Inventory turnover
Inventory turnover measures how many times a year your stock turns over: annual cost of goods sold divided by average inventory value. For example:
- Annual cost of goods sold: $300,000.
- Average stock value: $50,000.
- Turnover: $300,000 ÷ $50,000 = 6.
- Days to sell: 365 ÷ 6, so an average unit sells in about 61 days.
Turnover that falls year over year usually signals overbuying or weakening demand. Calculate it by category too, because a store-wide average hides products that barely move.
Dead stock
Dead stock is goods that haven't sold for a long time and aren't expected to sell at full price, such as last season's model or a product replaced by a newer version. Each business sets its own threshold, for example six months without a sale.
Say the warehouse holds 30 units of a product that cost $12 each and hasn't sold in six months: $360 is sitting on the shelf, taking space from products that do sell. Spot it early and pick an exit:
- A promotion on the product itself.
- A bundle with a best-seller.
- A return to the supplier, if your terms allow it.
- A clearance sale to free the space.
FIFO, LIFO and weighted average
The costing method decides which cost is recorded for each unit sold when you bought the same product at different prices. Say you bought 100 units at $5 in January, another 100 at $6.50 in March, and sold 120:
| Method | Cost of the 120 units sold | Value of the 80 units left |
|---|---|---|
| FIFO: first in, first out | 100 × $5 + 20 × $6.50 = $630 | 80 × $6.50 = $520 |
| LIFO: last in, first out | 100 × $6.50 + 20 × $5 = $750 | 80 × $5 = $400 |
| Weighted average: $5.75 per unit | 120 × $5.75 = $690 | 80 × $5.75 = $460 |
When prices are rising, FIFO shows higher profit and LIFO lower, with weighted average in between. US GAAP allows LIFO while IFRS does not, and switching methods later has tax consequences, so choose with your accountant. More on the differences in FIFO and LIFO.
Landed cost per unit
Landed cost is the full cost of a unit by the time it reaches your warehouse: the supplier's price plus freight, insurance, duties, brokerage and local delivery. Say a store imports 500 units:
- Supplier price: $2,000, or $4 per unit.
- Ocean freight: $400.
- Duties and brokerage: $250.
- Trucking from the port: $100.
- Total: $2,750, or $5.50 per unit rather than $4.
Price from $4 and the real margin is thinner than it looks. The term is explained in what is landed cost, and a full worked calculation is in our post on landed cost when importing from China.
Inventory management methods
No single method fits every product. Most stores combine several:
- One to focus: which products deserve the closest attention.
- One for accuracy: how the numbers stay right.
- One for timing: when and how much to order.
ABC analysis
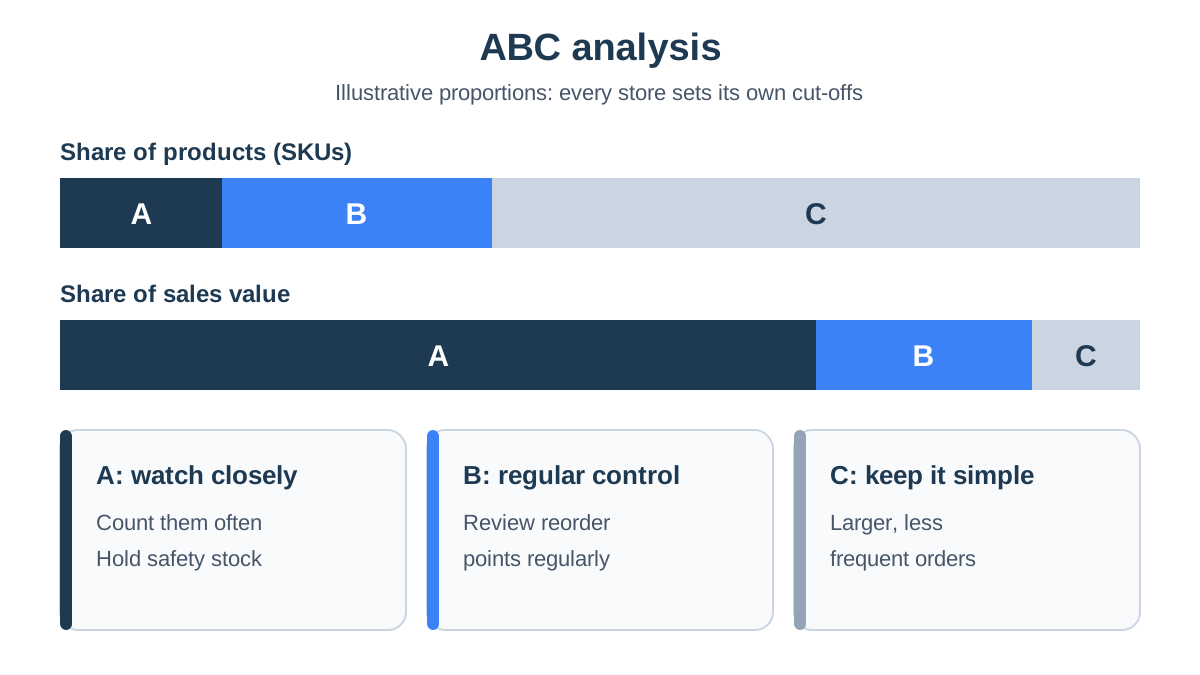
ABC analysis sorts products into three classes by how much they matter financially, usually by each product's annual sales value:
- A: a small number of products that bring in most of the sales value. Watch them most closely, count them most often and hold safety stock for them.
- B: the middle group, with regular control and a periodic review of reorder points.
- C: most of the catalog, each item contributing little. Manage them with simple rules and larger, less frequent orders.
Say a store with 300 SKUs sorts its products by last year's sales value, highest first, and finds that the top 45 bring in most of the revenue. Those are its A items. Each business sets the cut-offs from its own data, and the sort itself takes a few minutes in a spreadsheet.
Periodic counts or perpetual inventory
Two ways to know what you hold:
- Periodic counts: you count all the stock on a fixed date, such as year end, and between counts the numbers are an estimate. Simple, but problems only surface at the next count.
- Perpetual inventory: every movement is recorded as it happens. A supplier receipt increases stock and every order reduces it, so the system is always current.
An online store needs perpetual inventory, because the site keeps selling at night when nobody is counting.
Cycle counting
Even perpetual inventory needs checking against the shelf, because damage, picking errors and unrecorded returns build up quietly. Cycle counting counts a small part of the stock at a time, on a schedule, instead of closing the warehouse for a full count day. It pairs naturally with ABC analysis:
- A items: counted, say, monthly.
- B items: quarterly.
- C items: twice a year.
When there is a gap, don't just correct the number. Find what caused it: a receipt nobody recorded, a return that wasn't logged or an order shipped twice.
Just-in-time
With just-in-time, you order stock as close as possible to when you need it and keep minimal inventory.
- The upside: it saves cash and space.
- The condition: a reliable supplier with a short, predictable lead time.
- The limit: a store importing from Asia, with lead times of weeks and the risk of port delays, will struggle to work this way.
Safety stock and reorder points suit that store better, with just-in-time perhaps only for local suppliers.
Inventory management across stores and channels
A store that sells on one website has one stock number. Add a second WooCommerce store, a Shopify store, phone orders or sales over WhatsApp, and each channel holds its own number, which starts to drift from the others.
How overselling happens
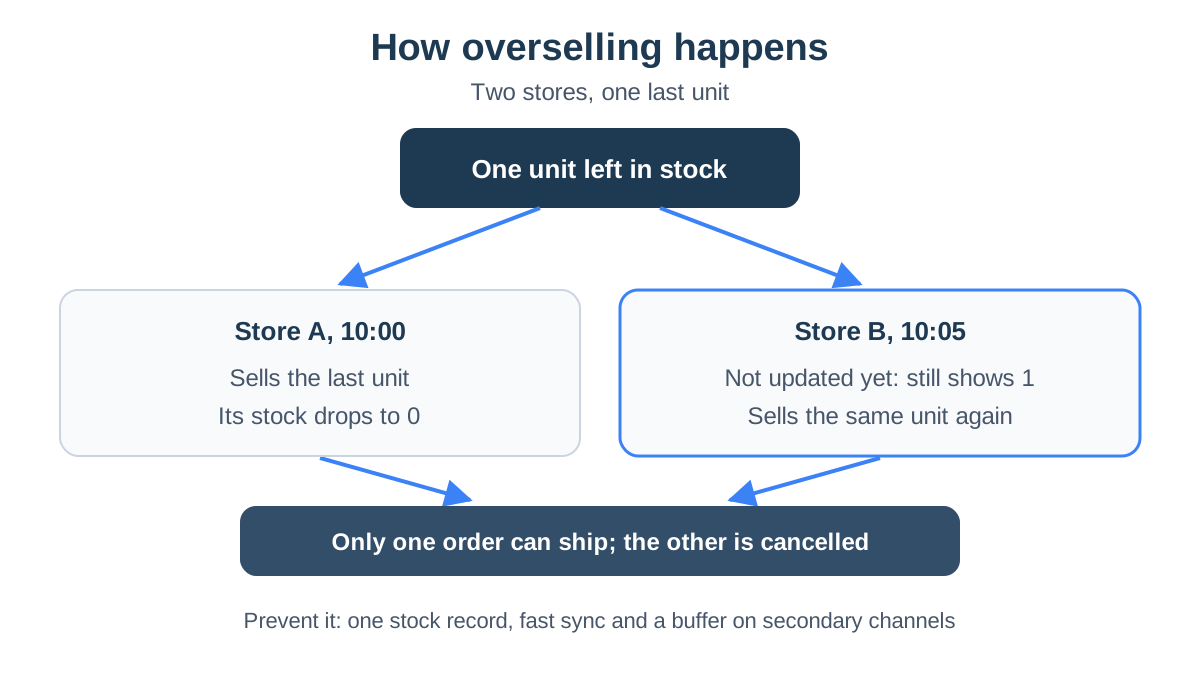
Overselling happens when two channels sell the same last unit. Here is how it plays out:
- One unit of a product is left.
- At 10:00 it sells in one store.
- The other store hasn't been updated yet, and at 10:05 another customer buys it there too.
- One order can't ship, and that customer gets a refund instead of a product.
Three main ways to reduce the risk:
- One stock record per item. A single source every channel updates on each sale, not a separate number per store.
- Fast sync. The shorter the delay between a sale and the update on other channels, the smaller the risk. A daily update is not enough for a product that sells several times an hour.
- A buffer on each channel. Show slightly less than your true stock on secondary channels, for example by hiding the last two units, so the main channel isn't left short.
Available vs on-hand stock
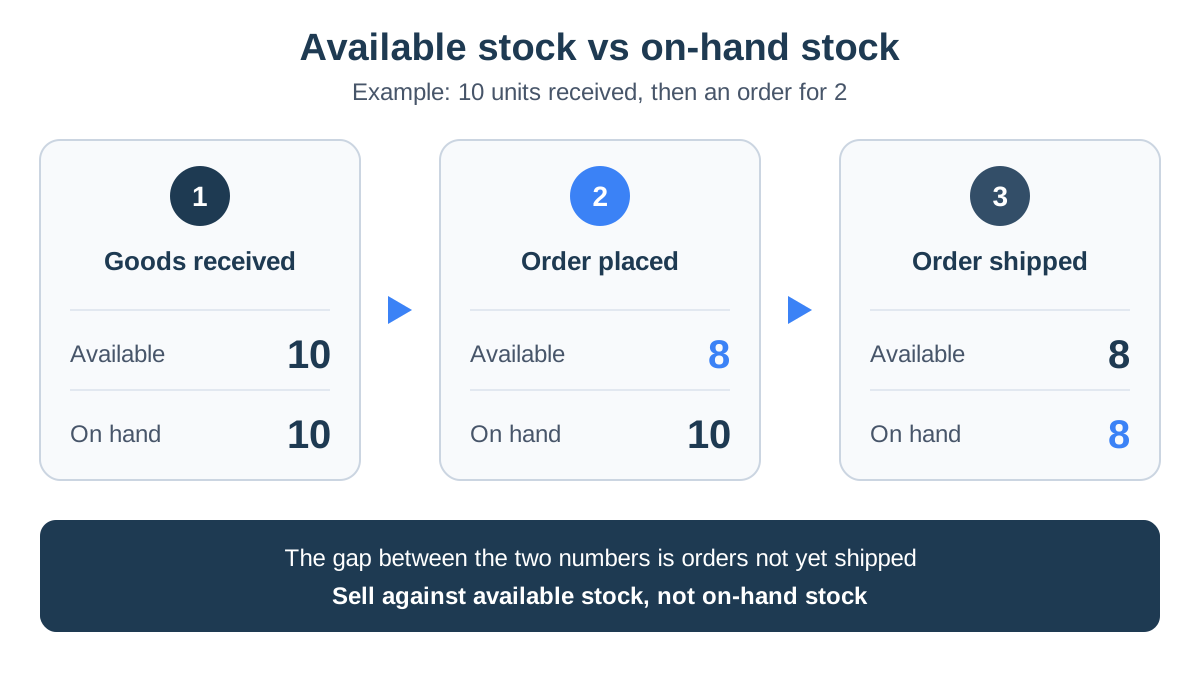
When you sell on several channels, keep two numbers apart:
- Available stock: drops the moment an order comes in, because that unit already belongs to a customer.
- On-hand stock: drops only when the package leaves the warehouse.
- The difference: orders not yet shipped.
Selling against on-hand stock means selling units already promised to someone else.
Multi-store inventory in StoreChart
In StoreChart you connect WooCommerce and Shopify stores, and their orders come into the system as they are created. You can also sync past orders. This is how stock moves:
- New order: reduces available stock for products with inventory tracking on.
- Cancellation or refund: an order marked as cancelled or refunded returns those units to stock.
- Shipping: on-hand stock drops when the order ships from one of your warehouses.
- Inventory screen: products from every store, filterable by store and by low or zero stock.
The orders themselves live in the orders module. Two caveats:
- No write-back to stores: StoreChart does not write stock levels back to WooCommerce or Shopify, so each store's own stock settings still decide what shoppers can order there.
- One store per product: a SKU sold in two stores is managed as two separate stock records.
See the WooCommerce integration and Shopify integration pages, and multi-store management for running several stores in one place.
When goods are split across locations, every store has a default warehouse and you can add more:
- When receiving: you choose which warehouse the goods go into.
- When shipping: you choose which warehouse the order leaves from.
- On each product: you see what was received, shipped and remains in each warehouse.
We go deeper in the guide to multi-warehouse inventory management.
Inventory software or a spreadsheet
Most stores start with a spreadsheet, and reasonably so: it is free, flexible and familiar. A spreadsheet is enough with a small catalog, one sales channel and one person who updates it regularly.
The problem is that a spreadsheet doesn't know when an order comes in, so every number in it is only right until the next manual update. We cover how to build a good stock sheet, and where it breaks, in the guide to inventory management in Excel.
Signs you need inventory software
Move when you see any of these:
- Several people edit the same file, and nobody is sure who changed what, or when.
- You sell on more than one channel and adjust stock by hand after every order.
- Each count reveals bigger gaps than the last.
- You import goods with costs that must be spread across every unit to know the landed cost.
- Your stock sits in more than one warehouse.
- More time goes into reconciling data than into decisions.
What to check in an inventory system
- Store connections: what data moves, in which direction and how fast. It is the key question if you sell on several channels.
- Receipts: recorded with the supplier and a cost per unit, not just a unit count.
- Costing: a method that fits your reporting, plus landed cost for imports.
- Available and on-hand stock: two separate numbers, not one.
- Warehouses: if your stock is in more than one place.
- Import and export: CSV files, to bring data in at the start and take it out if you ever leave.
The StoreChart inventory module
The StoreChart inventory module is built around a record of stock movements:
- Receipts: each one is recorded with the supplier, the invoice number and the cost per unit, and documented in a stock receipt.
- Imports: the imports module calculates landed cost per item, including the exchange rate and costs allocated by volume, and receives the goods into stock at that cost.
- Costing: for each product you choose fixed cost, weighted average or FIFO, and set a low-stock threshold.
- Product view: how much was received, sold, shipped and remains, along with its list of receipts.
- Dead stock: sort the inventory list by units sold and by last sale date.
Products can be imported from a CSV file together with an opening stock quantity.
An inventory process in seven steps
Whether you are starting fresh or tidying up existing stock:
- Clean up the catalog. A unique SKU for every variant, no duplicates, and the same code on every channel where the product sells.
- Do an opening count. Count all stock once, on a quiet day, and record the quantity and cost per unit for every item. Without a correct starting point, every later calculation is off.
- Choose a costing method. FIFO, weighted average or fixed cost, agreed with your accountant, and stick with it.
- Record every receipt. Log each supplier delivery on the day it arrives, with the supplier and cost. For imported products, record the landed cost, not the supplier price.
- Connect your sales channels. Every order, from every store, should reduce stock without manual typing. Also decide which system sets the stock shown to shoppers in each store.
- Set reorder points. Start with your A items from the ABC analysis, calculate safety stock and a reorder point for each, and set a low-stock threshold.
- Schedule counts and a monthly review. Cycle counts by class, and once a month a look at turnover, dead stock and reorder points that no longer fit the sales pace.
Common inventory management mistakes
- Counting once a year and nothing more. Gaps build for months, and by then nobody can tell what caused them.
- One threshold for every product. A product that sells ten times a day and one that sells once a week need different reorder points.
- Costing from the supplier price. Without freight, duties and brokerage, the margin on paper is higher than the real one.
- Selling against on-hand stock. Units promised to unshipped orders can't be sold again.
- A different SKU on each channel. Then nobody can tell it is the same product, and the stock splits.
- Fixing gaps without investigating. Overwrite the number without asking why, and the same gap returns at the next count.
- Ignoring dead stock. Every month that passes lowers the chance of selling it at a reasonable price.
- Assuming your stores are in sync. Check exactly what moves between systems, and in which direction, before trusting the number shoppers see.
Key takeaways
- Inventory management is a cycle of ordering, receiving, storing, selling and reordering, and the goal is to fill every order without carrying excess.
- The reorder point is demand during the lead time plus safety stock, and safety stock absorbs delays and sales spikes.
- ABC analysis tells you where to focus, and cycle counting keeps the numbers right without a long count day.
- When you sell on several channels, sell against available stock and check which direction stock syncs between systems.
- Price imported products from landed cost, not the supplier price.
Frequently asked questions
What are the main inventory management methods?
The four most common are ABC analysis, which decides which products deserve the closest attention; perpetual inventory, which records every receipt and sale as it happens, versus periodic counts; cycle counting, which counts a small part of the stock at a time; and just-in-time, which orders stock close to when it is needed. Most stores combine several.
How do you calculate a reorder point?
Multiply average daily sales by the supplier's lead time in days, then add safety stock. For example, a product that sells 8 units a day, from a supplier that delivers in 14 days, with 68 units of safety stock, has a reorder point of 180 units. When available stock falls to that level, you place the order.
How often should you count inventory?
It depends on how much each product matters. A common approach is cycle counting by ABC class: A items counted, say, monthly, B items quarterly and C items twice a year. Add an extra count after any unusual discrepancy, after moving warehouses, or before a busy season.
When should you move inventory off a spreadsheet?
When more than one person edits the file, when you sell on more than one channel and adjust stock by hand after orders, when counts keep revealing bigger gaps, or when imports require landed cost per unit. At that point the time spent reconciling data costs more than software.
How do you prevent overselling across several channels?
Keep one stock record per item that every channel updates, shorten the delay between a sale and the update on other channels as much as possible, and show slightly less than your true stock on secondary channels. Sell against available stock, which already deducts unshipped orders, rather than on-hand stock.
Does StoreChart update stock levels in WooCommerce and Shopify?
No. Orders from connected WooCommerce and Shopify stores flow into StoreChart and reduce its stock for products with inventory tracking on, but StoreChart does not write stock levels back to those stores. Each store's own stock settings decide what shoppers can order there.
Can StoreChart manage more than one warehouse?
Yes. Every store has a default warehouse, and you can add more. When receiving stock, including from an import, you choose which warehouse it goes into; when shipping an order, you choose which warehouse it leaves from; and each product shows what was received, shipped and remains in each warehouse.