
Once stock lives in more than one place, a single number per product stops being useful. You need to know that 40 units exist, but also that 25 are in the main warehouse, 15 at a second site, and which of them can ship today's orders. Getting that right depends less on software than on routine: how goods are received, put away, picked and counted. This guide to multi-warehouse inventory management covers those practices, order allocation, safety stock per location, the KPIs worth tracking, when a WMS is justified, and exactly what StoreChart does and does not do with several warehouses.
What is multi-warehouse inventory management?
It is inventory management with a second dimension. Instead of one stock figure per SKU, you track stock per SKU per location. On top of that you need:
- Movements by location: goods received into warehouse A, an order shipped from warehouse B.
- Allocation rules: which location fulfills which order.
- Replenishment: a separate plan for each location.
It also helps to separate two numbers:
- Available: what you can still promise to customers. It drops the moment an order is placed.
- On hand: what physically sits on the shelves. It drops only when goods leave the building.
Between an order and its shipment the two differ, and knowing both prevents overselling and false panic.
Warehouse inventory management practices
Receiving goods
- Count against the paperwork: check every delivery against the purchase order or supplier invoice before it enters stock.
- Log shortages separately: record missing and damaged units rather than quietly adjusting the count.
- Receive where it landed: into the warehouse the goods physically reached, on the day they arrived, with the unit cost. Later cost and profit figures are built on it.
Put-away and bin locations
- An address for every spot: aisle, rack, shelf and bin, with a record of where each SKU lives.
- Fast movers near packing: and heavy items low.
- A fixed home per product: makes picking faster and counting possible. "Wherever there's space" works only until the person who remembers is on holiday.
Picking and packing
- Pick lists by location: a picker walks the warehouse once.
- Batch picking: for small orders, several orders in one pass saves walking.
- Verify before sealing: scan or check the SKU against the order. A wrong item costs a return, a reship and often a customer.
Cycle counts in the warehouse
Instead of one annual stocktake that closes the warehouse, count a small set of SKUs every week, high-value and fast-moving items most often. When a count differs from the record, find out why before correcting it:
- A missed receipt.
- An unrecorded return.
- A mis-pick.
A correction with no explanation will happen again.
Transfers between warehouses
A transfer is two movements, and recording only one side either counts the goods twice or loses them:
- Out of the sending warehouse.
- Ideally, an in-transit state in between.
- Into the receiving warehouse, counted on receipt like any delivery.
Order allocation across warehouses
Common allocation rules, in rough order of priority:
- Can one warehouse ship the whole order? Split shipments cost more and confuse customers.
- Which warehouse is closest to the customer? Shorter transit, often cheaper shipping.
- Which warehouse has the most stock of the items, so the others keep their safety stock?
- Otherwise, a default warehouse.
Whatever the rule, write it down so everyone who ships orders applies it the same way. Fulfillment options, including outsourced ones, are explained in our glossary entry on fulfillment.
Safety stock per location
Safety stock covers the gap between a normal week and a bad one. A widely used formula:
Safety stock = (maximum daily sales × maximum lead time) − (average daily sales × average lead time)
Say a warehouse sells a SKU like this:
- Daily sales: 10 units on an average day, 16 on a busy one.
- Lead time: 7 days on average, 10 at worst.
- Safety stock: 16 × 10 − 10 × 7 = 90 units.
- Reorder point: average demand during lead time plus safety stock, 70 + 90 = 160 units.
A second site that sells half as much, from a closer supplier, gets its own, smaller numbers. One figure for the whole company hides exactly the risk you are trying to cover.
Warehouse KPIs to track
| KPI | How to calculate it | What it tells you |
|---|---|---|
| Inventory accuracy | SKUs whose count matches the record ÷ SKUs counted | Whether you can trust the numbers |
| Order fill rate | Orders shipped complete ÷ all orders | Whether stock is in the right place |
| Pick accuracy | Orders picked without error ÷ orders picked | Quality of the picking process |
| Inventory turnover | Cost of goods sold ÷ average inventory value | How fast stock converts to sales |
| Days on hand | Average inventory value ÷ daily cost of goods sold | How long stock sits |
| Dock-to-stock time | Time from delivery to available for sale | How fast receiving works |
| Split-shipment rate | Orders shipped from two or more warehouses ÷ all orders | Whether allocation works |
Track them per warehouse. A company-wide average can look fine while one site drags it down.
When you need warehouse management software
Inventory software answers "how much, where, and what is it worth". Warehouse management software runs the work on the floor. You likely need a WMS when:
- you need stock tracked down to the bin or shelf, not just the building;
- pickers need directed routes and scan-to-confirm at every step;
- you manage lots, serial numbers or expiry dates;
- several shifts or dozens of staff need tasks assigned and measured;
- order volume makes paper pick lists a bottleneck.
If those don't apply yet, good inventory software plus the routines above usually carries a business much further than expected.
Multiple warehouses in StoreChart
StoreChart tracks warehouses, but it is not a WMS. Here is exactly what it supports.
What StoreChart records
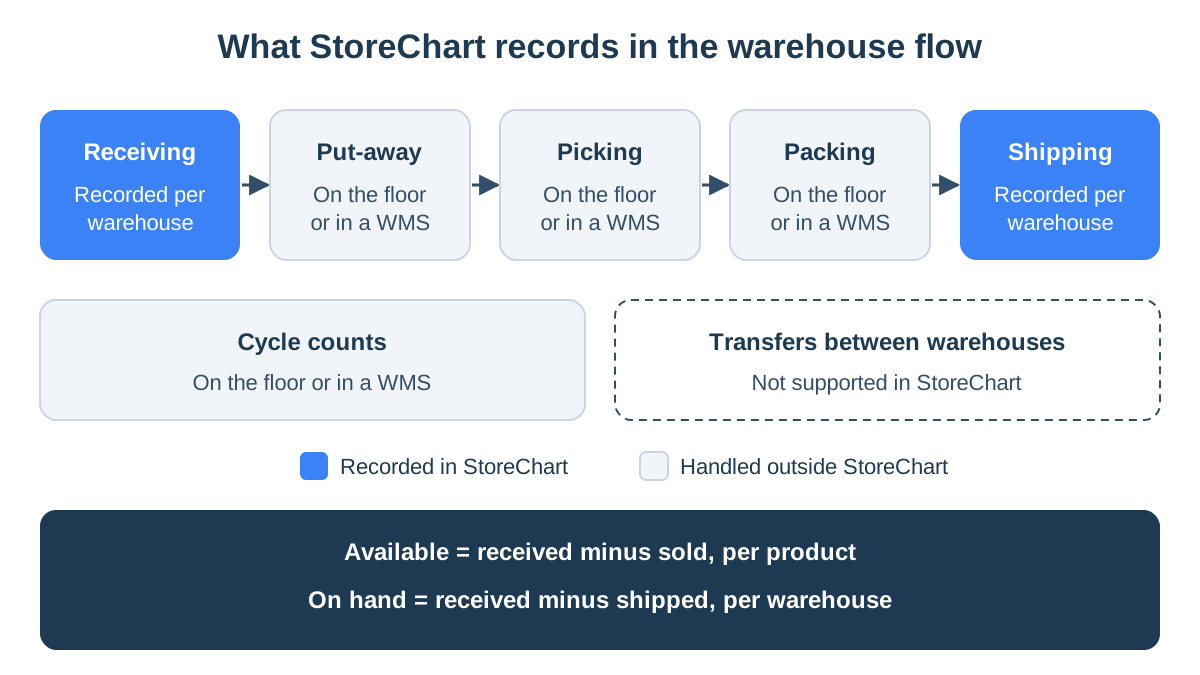
- Warehouses per store. Every store starts with a default warehouse, created automatically, and you can add more on the Stock Locations page. Each warehouse belongs to one store. If you run several stores, each has its own warehouses, as described on the multi-store page.
- Receiving into a chosen warehouse. A stock intake, typed in or loaded from a CSV of SKU, quantity and cost, goes into the warehouse you pick, with the supplier and invoice number if you add them. When you receive an import shipment, you choose the destination warehouse for each store the goods belong to.
- Shipping from a chosen warehouse. On an order, you ship all or some of the items and pick the warehouse when the store has more than one. A shipment can be edited or cancelled, and cancelling returns the units to that warehouse. Orders sent through a connected shipping provider draw stock from the warehouse set in that integration, or from the store's default warehouse.
- Both numbers. Available stock, received minus sold, drops when an order is created and is kept per product. On-hand stock is kept per warehouse and drops only when a shipment leaves it.
- A view per warehouse. Units, number of products in stock and stock value for each warehouse, and, on every product, what was received, shipped and is on hand in each one.
- Cost per warehouse. With FIFO costing, each shipment's cost comes from the oldest receipts at the warehouse it ships from. See FIFO and LIFO.
Who it's for and what's not included
What StoreChart does not have:
- Bins: no bin or shelf locations inside a warehouse.
- Transfers: no transfers between warehouses.
- Floor workflows: no cycle-count workflow and no pick lists.
- Rule-based allocation: the warehouse is chosen by hand, by the shipping integration or by the default.
- Available stock per warehouse: it is not split by warehouse, so you cannot sell only what one site holds.
StoreChart is a good fit for online stores with a few stock locations, such as a main storeroom and a second site, that need to know what is where, what it is worth and where imports landed. If you need bin-level tracking and directed picking, run a WMS on the floor.
Still tracking locations in a spreadsheet? Our guide to inventory management in Excel shows how to add a location column and move to software later. For the full picture, return to the complete guide to inventory management.
Frequently asked questions
What is the difference between inventory management software and a WMS?
Inventory management software tracks how much stock you have, where, and what it is worth, and connects it to orders and purchasing. A WMS (warehouse management system) runs the work inside the building: bin locations, directed put-away, pick routes, scanning at each step and labor tracking. Many businesses use both.
Does StoreChart support more than one warehouse?
Yes, within each store. You can add warehouses to a store, receive stock into a chosen warehouse, and ship orders from a chosen warehouse, and StoreChart shows units, products and stock value per warehouse. It does not track bins, transfer stock between warehouses or allocate orders automatically, so it is not a WMS.
How do you calculate safety stock for each warehouse?
A common formula is maximum daily sales times maximum lead time, minus average daily sales times average lead time. Calculate it separately for each location with that location's own sales and replenishment times, because a warehouse far from the supplier or with spikier demand needs a bigger buffer.
How often should you run cycle counts?
Many teams count by value class: the small group of SKUs that make up most of the stock value monthly or even weekly, the middle group quarterly, and the long tail once or twice a year. Count more often wherever discrepancies keep showing up.